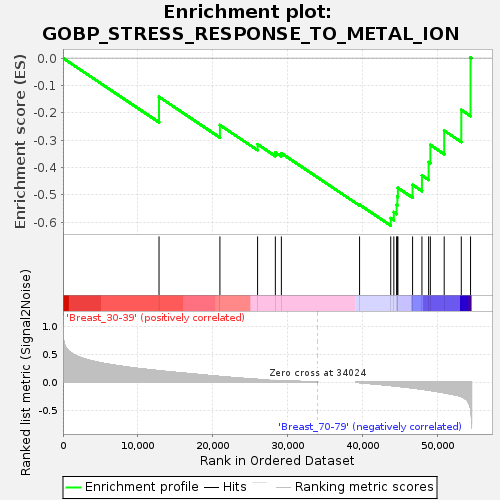
Profile of the Running ES Score & Positions of GeneSet Members on the Rank Ordered List
| Dataset | Breast.Breast.cls #Breast_30-39_versus_Breast_70-79.Breast.cls #Breast_30-39_versus_Breast_70-79_repos |
| Phenotype | Breast.cls#Breast_30-39_versus_Breast_70-79_repos |
| Upregulated in class | Breast_70-79 |
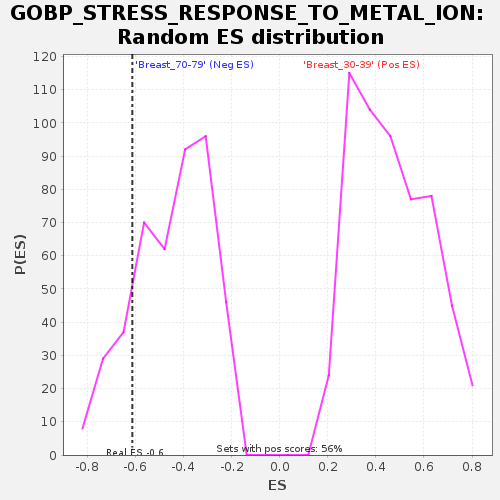
| GeneSet | GOBP_STRESS_RESPONSE_TO_METAL_ION |
| Enrichment Score (ES) | -0.6127215 |
| Normalized Enrichment Score (NES) | -1.3688056 |
| Nominal p-value | 0.15227273 |
| FDR q-value | 0.98857677 |
| FWER p-Value | 0.991 |
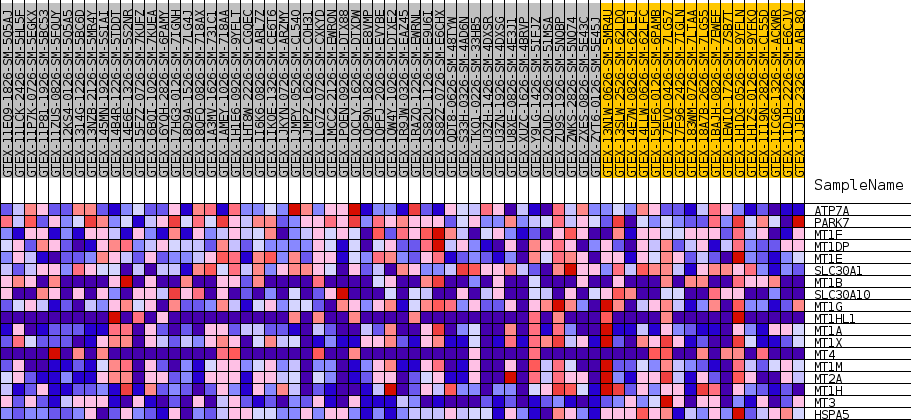
| SYMBOL | TITLE | RANK IN GENE LIST | RANK METRIC SCORE | RUNNING ES | CORE ENRICHMENT | |
|---|---|---|---|---|---|---|
| 1 | ATP7A | NA | 12830 | 0.203 | -0.1418 | No |
| 2 | PARK7 | NA | 20966 | 0.100 | -0.2449 | No |
| 3 | MT1F | NA | 25999 | 0.048 | -0.3152 | No |
| 4 | MT1DP | NA | 28373 | 0.030 | -0.3449 | No |
| 5 | MT1E | NA | 29177 | 0.025 | -0.3481 | No |
| 6 | SLC30A1 | NA | 39626 | -0.007 | -0.5365 | No |
| 7 | MT1B | NA | 43789 | -0.059 | -0.5856 | Yes |
| 8 | SLC30A10 | NA | 44205 | -0.065 | -0.5634 | Yes |
| 9 | MT1G | NA | 44574 | -0.070 | -0.5378 | Yes |
| 10 | MT1HL1 | NA | 44676 | -0.072 | -0.5068 | Yes |
| 11 | MT1A | NA | 44749 | -0.073 | -0.4746 | Yes |
| 12 | MT1X | NA | 46709 | -0.102 | -0.4635 | Yes |
| 13 | MT4 | NA | 47959 | -0.125 | -0.4291 | Yes |
| 14 | MT1M | NA | 48853 | -0.141 | -0.3806 | Yes |
| 15 | MT2A | NA | 49083 | -0.146 | -0.3176 | Yes |
| 16 | MT1H | NA | 50933 | -0.188 | -0.2652 | Yes |
| 17 | MT3 | NA | 53217 | -0.256 | -0.1894 | Yes |
| 18 | HSPA5 | NA | 54454 | -0.467 | 0.0025 | Yes |