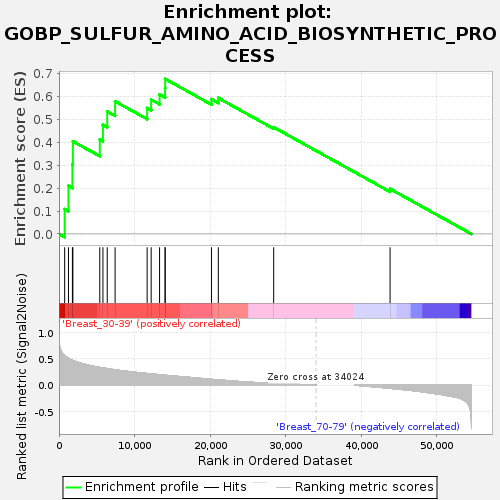
Profile of the Running ES Score & Positions of GeneSet Members on the Rank Ordered List
| Dataset | Breast.Breast.cls #Breast_30-39_versus_Breast_70-79.Breast.cls #Breast_30-39_versus_Breast_70-79_repos |
| Phenotype | Breast.cls#Breast_30-39_versus_Breast_70-79_repos |
| Upregulated in class | Breast_30-39 |
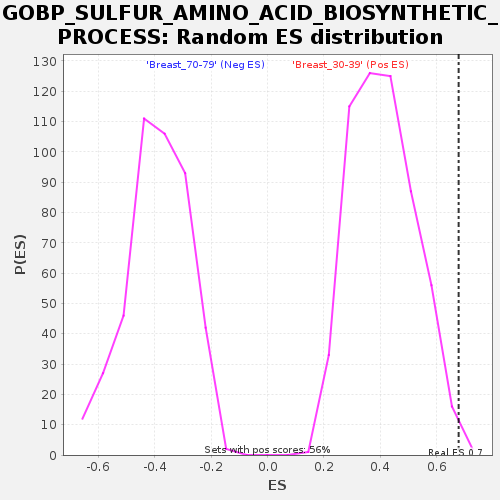
| GeneSet | GOBP_SULFUR_AMINO_ACID_BIOSYNTHETIC_PROCESS |
| Enrichment Score (ES) | 0.677564 |
| Normalized Enrichment Score (NES) | 1.6516732 |
| Nominal p-value | 0.0035650623 |
| FDR q-value | 0.23990318 |
| FWER p-Value | 0.798 |
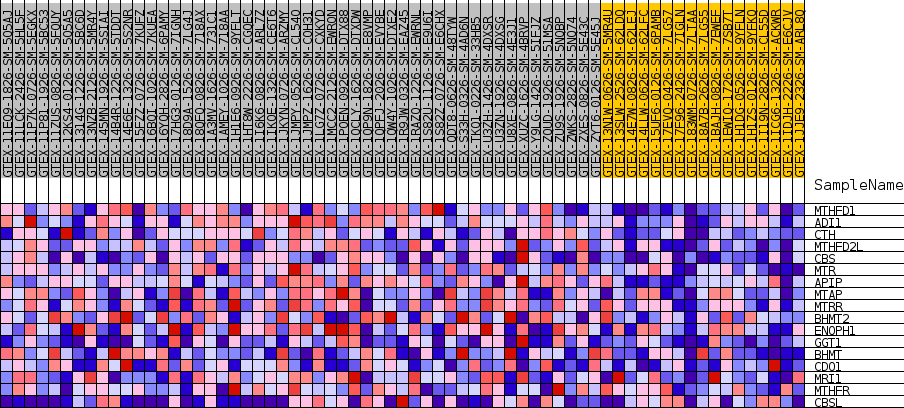
| SYMBOL | TITLE | RANK IN GENE LIST | RANK METRIC SCORE | RUNNING ES | CORE ENRICHMENT | |
|---|---|---|---|---|---|---|
| 1 | MTHFD1 | NA | 751 | 0.557 | 0.1084 | Yes |
| 2 | ADI1 | NA | 1253 | 0.507 | 0.2105 | Yes |
| 3 | CTH | NA | 1775 | 0.469 | 0.3040 | Yes |
| 4 | MTHFD2L | NA | 1836 | 0.466 | 0.4052 | Yes |
| 5 | CBS | NA | 5399 | 0.334 | 0.4133 | Yes |
| 6 | MTR | NA | 5816 | 0.325 | 0.4769 | Yes |
| 7 | APIP | NA | 6386 | 0.312 | 0.5350 | Yes |
| 8 | MTAP | NA | 7426 | 0.290 | 0.5796 | Yes |
| 9 | MTRR | NA | 11668 | 0.219 | 0.5500 | Yes |
| 10 | BHMT2 | NA | 12202 | 0.212 | 0.5868 | Yes |
| 11 | ENOPH1 | NA | 13314 | 0.196 | 0.6095 | Yes |
| 12 | GGT1 | NA | 14045 | 0.186 | 0.6369 | Yes |
| 13 | BHMT | NA | 14055 | 0.186 | 0.6776 | Yes |
| 14 | CDO1 | NA | 20182 | 0.109 | 0.5893 | No |
| 15 | MRI1 | NA | 21090 | 0.098 | 0.5942 | No |
| 16 | MTHFR | NA | 28420 | 0.030 | 0.4665 | No |
| 17 | CBSL | NA | 43828 | -0.060 | 0.1972 | No |