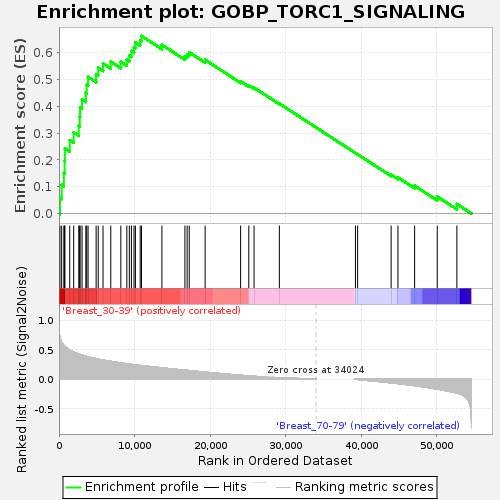
Profile of the Running ES Score & Positions of GeneSet Members on the Rank Ordered List
| Dataset | Breast.Breast.cls #Breast_30-39_versus_Breast_70-79.Breast.cls #Breast_30-39_versus_Breast_70-79_repos |
| Phenotype | Breast.cls#Breast_30-39_versus_Breast_70-79_repos |
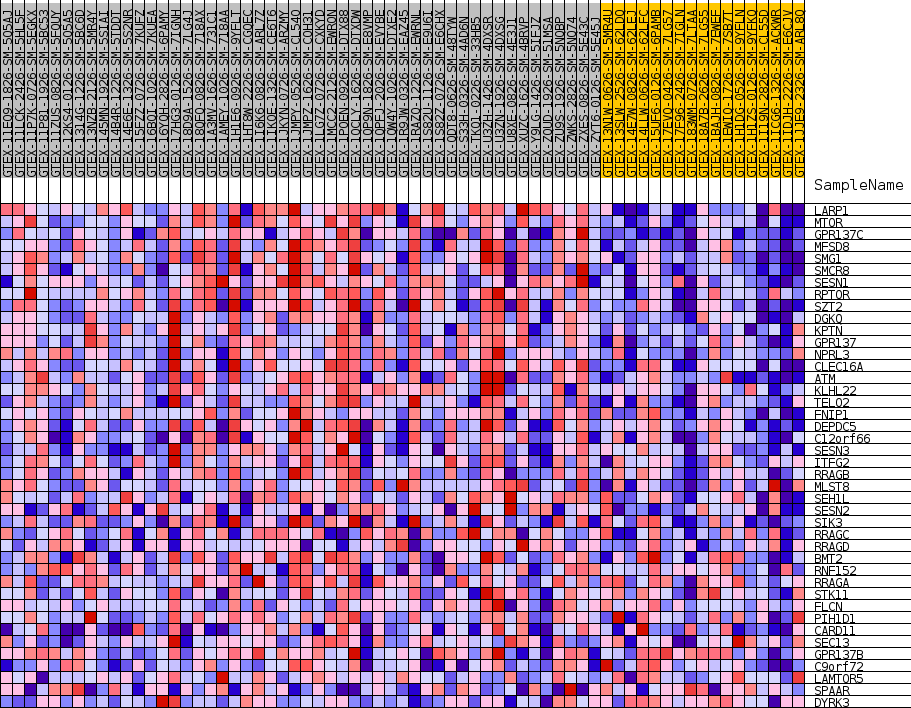
| Upregulated in class | Breast_30-39 |
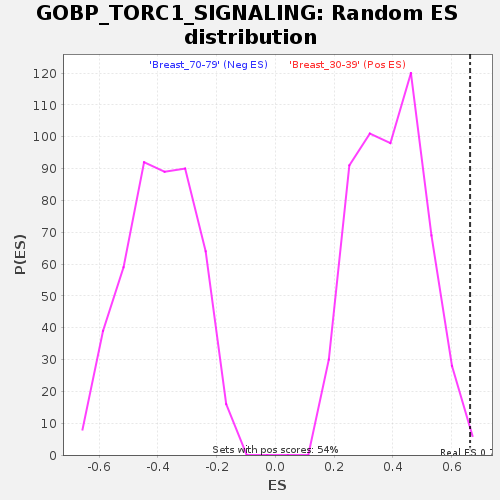
| GeneSet | GOBP_TORC1_SIGNALING |
| Enrichment Score (ES) | 0.66268176 |
| Normalized Enrichment Score (NES) | 1.694069 |
| Nominal p-value | 0.0036832413 |
| FDR q-value | 0.30175206 |
| FWER p-Value | 0.67 |
| SYMBOL | TITLE | RANK IN GENE LIST | RANK METRIC SCORE | RUNNING ES | CORE ENRICHMENT | |
|---|---|---|---|---|---|---|
| 1 | LARP1 | NA | 129 | 0.706 | 0.0579 | Yes |
| 2 | MTOR | NA | 355 | 0.623 | 0.1070 | Yes |
| 3 | GPR137C | NA | 640 | 0.571 | 0.1506 | Yes |
| 4 | MFSD8 | NA | 744 | 0.557 | 0.1963 | Yes |
| 5 | SMG1 | NA | 771 | 0.553 | 0.2431 | Yes |
| 6 | SMCR8 | NA | 1422 | 0.494 | 0.2734 | Yes |
| 7 | SESN1 | NA | 1945 | 0.459 | 0.3030 | Yes |
| 8 | RPTOR | NA | 2617 | 0.426 | 0.3271 | Yes |
| 9 | SZT2 | NA | 2741 | 0.420 | 0.3607 | Yes |
| 10 | DGKQ | NA | 2788 | 0.418 | 0.3956 | Yes |
| 11 | KPTN | NA | 3051 | 0.407 | 0.4256 | Yes |
| 12 | GPR137 | NA | 3554 | 0.389 | 0.4496 | Yes |
| 13 | NPRL3 | NA | 3665 | 0.385 | 0.4805 | Yes |
| 14 | CLEC16A | NA | 3849 | 0.378 | 0.5094 | Yes |
| 15 | ATM | NA | 4915 | 0.348 | 0.5196 | Yes |
| 16 | KLHL22 | NA | 5191 | 0.340 | 0.5436 | Yes |
| 17 | TELO2 | NA | 5827 | 0.324 | 0.5597 | Yes |
| 18 | FNIP1 | NA | 6853 | 0.302 | 0.5667 | Yes |
| 19 | DEPDC5 | NA | 8185 | 0.275 | 0.5658 | Yes |
| 20 | C12orf66 | NA | 8979 | 0.262 | 0.5737 | Yes |
| 21 | SESN3 | NA | 9310 | 0.256 | 0.5894 | Yes |
| 22 | ITFG2 | NA | 9584 | 0.251 | 0.6059 | Yes |
| 23 | RRAGB | NA | 9928 | 0.246 | 0.6206 | Yes |
| 24 | MLST8 | NA | 10116 | 0.243 | 0.6379 | Yes |
| 25 | SEH1L | NA | 10749 | 0.233 | 0.6462 | Yes |
| 26 | SESN2 | NA | 10921 | 0.230 | 0.6627 | Yes |
| 27 | SIK3 | NA | 13622 | 0.192 | 0.6296 | No |
| 28 | RRAGC | NA | 16668 | 0.153 | 0.5868 | No |
| 29 | RRAGD | NA | 16964 | 0.150 | 0.5942 | No |
| 30 | BMT2 | NA | 17242 | 0.146 | 0.6016 | No |
| 31 | RNF152 | NA | 19344 | 0.120 | 0.5733 | No |
| 32 | RRAGA | NA | 24043 | 0.066 | 0.4929 | No |
| 33 | STK11 | NA | 25125 | 0.056 | 0.4778 | No |
| 34 | FLCN | NA | 25822 | 0.049 | 0.4693 | No |
| 35 | PIH1D1 | NA | 29171 | 0.025 | 0.4100 | No |
| 36 | CARD11 | NA | 39245 | -0.002 | 0.2255 | No |
| 37 | SEC13 | NA | 39533 | -0.005 | 0.2207 | No |
| 38 | GPR137B | NA | 43967 | -0.062 | 0.1447 | No |
| 39 | C9orf72 | NA | 44870 | -0.074 | 0.1345 | No |
| 40 | LAMTOR5 | NA | 47078 | -0.109 | 0.1034 | No |
| 41 | SPAAR | NA | 50072 | -0.168 | 0.0629 | No |
| 42 | DYRK3 | NA | 52670 | -0.234 | 0.0352 | No |