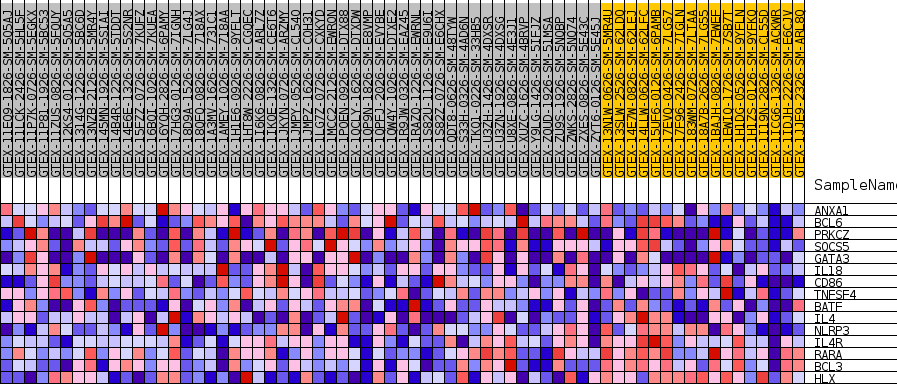
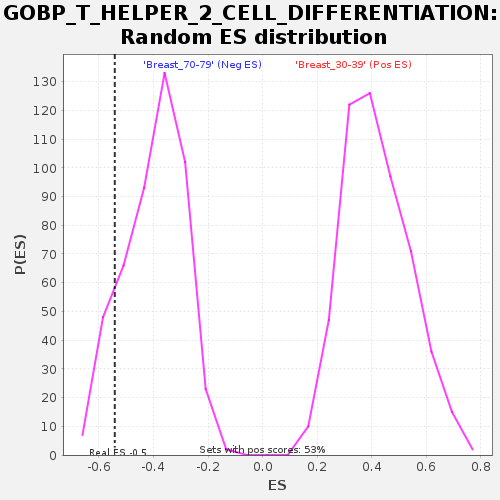
Profile of the Running ES Score & Positions of GeneSet Members on the Rank Ordered List
| Dataset | Breast.Breast.cls #Breast_30-39_versus_Breast_70-79.Breast.cls #Breast_30-39_versus_Breast_70-79_repos |
| Phenotype | Breast.cls#Breast_30-39_versus_Breast_70-79_repos |
| Upregulated in class | Breast_70-79 |
| GeneSet | GOBP_T_HELPER_2_CELL_DIFFERENTIATION |
| Enrichment Score (ES) | -0.5419622 |
| Normalized Enrichment Score (NES) | -1.360971 |
| Nominal p-value | 0.12236287 |
| FDR q-value | 0.98030615 |
| FWER p-Value | 0.992 |
| SYMBOL | TITLE | RANK IN GENE LIST | RANK METRIC SCORE | RUNNING ES | CORE ENRICHMENT | |
|---|---|---|---|---|---|---|
| 1 | ANXA1 | NA | 9178 | 0.258 | -0.0741 | No |
| 2 | BCL6 | NA | 14553 | 0.179 | -0.1071 | No |
| 3 | PRKCZ | NA | 17376 | 0.145 | -0.1061 | No |
| 4 | SOCS5 | NA | 17545 | 0.143 | -0.0572 | No |
| 5 | GATA3 | NA | 19337 | 0.120 | -0.0465 | No |
| 6 | IL18 | NA | 26968 | 0.040 | -0.1718 | No |
| 7 | CD86 | NA | 27985 | 0.033 | -0.1785 | No |
| 8 | TNFSF4 | NA | 28156 | 0.032 | -0.1701 | No |
| 9 | BATF | NA | 30766 | 0.016 | -0.2120 | No |
| 10 | IL4 | NA | 45895 | -0.090 | -0.4564 | No |
| 11 | NLRP3 | NA | 50431 | -0.176 | -0.4755 | Yes |
| 12 | IL4R | NA | 54057 | -0.333 | -0.4204 | Yes |
| 13 | RARA | NA | 54161 | -0.354 | -0.2933 | Yes |
| 14 | BCL3 | NA | 54289 | -0.390 | -0.1536 | Yes |
| 15 | HLX | NA | 54405 | -0.436 | 0.0034 | Yes |