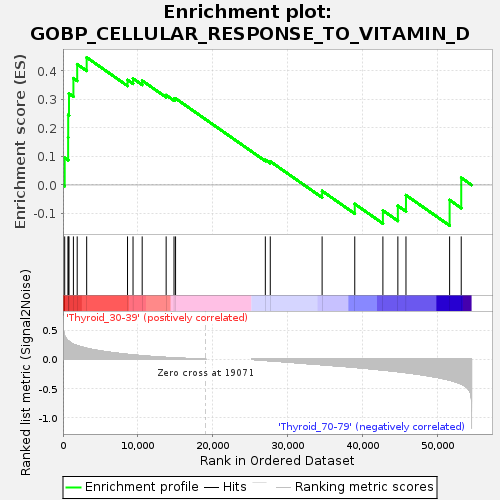
Profile of the Running ES Score & Positions of GeneSet Members on the Rank Ordered List
| Dataset | Thyroid.Thyroid.cls #Thyroid_30-39_versus_Thyroid_70-79.Thyroid.cls #Thyroid_30-39_versus_Thyroid_70-79_repos |
| Phenotype | Thyroid.cls#Thyroid_30-39_versus_Thyroid_70-79_repos |
| Upregulated in class | Thyroid_30-39 |
| GeneSet | GOBP_CELLULAR_RESPONSE_TO_VITAMIN_D |
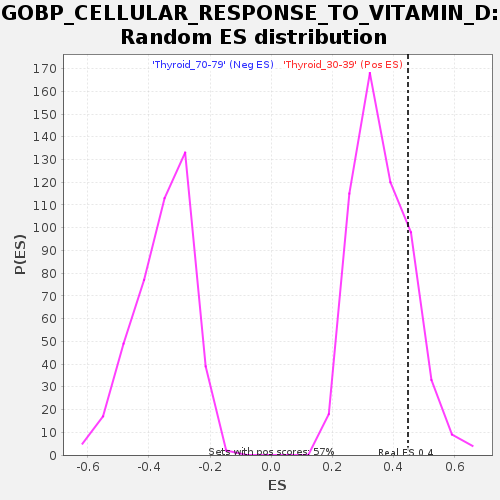
| Enrichment Score (ES) | 0.44754478 |
| Normalized Enrichment Score (NES) | 1.2419894 |
| Nominal p-value | 0.18584071 |
| FDR q-value | 1.0 |
| FWER p-Value | 1.0 |
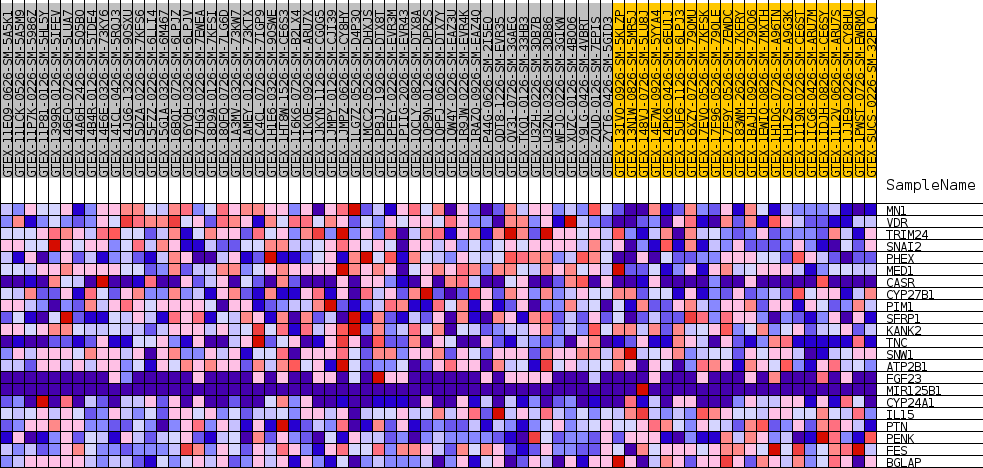
| SYMBOL | TITLE | RANK IN GENE LIST | RANK METRIC SCORE | RUNNING ES | CORE ENRICHMENT | |
|---|---|---|---|---|---|---|
| 1 | MN1 | NA | 227 | 0.395 | 0.0952 | Yes |
| 2 | VDR | NA | 686 | 0.317 | 0.1665 | Yes |
| 3 | TRIM24 | NA | 695 | 0.316 | 0.2458 | Yes |
| 4 | SNAI2 | NA | 801 | 0.305 | 0.3206 | Yes |
| 5 | PHEX | NA | 1390 | 0.257 | 0.3745 | Yes |
| 6 | MED1 | NA | 1897 | 0.232 | 0.4236 | Yes |
| 7 | CASR | NA | 3163 | 0.187 | 0.4475 | Yes |
| 8 | CYP27B1 | NA | 8621 | 0.083 | 0.3684 | No |
| 9 | PIM1 | NA | 9357 | 0.074 | 0.3735 | No |
| 10 | SFRP1 | NA | 10580 | 0.060 | 0.3661 | No |
| 11 | KANK2 | NA | 13782 | 0.031 | 0.3152 | No |
| 12 | TNC | NA | 14833 | 0.023 | 0.3018 | No |
| 13 | SNW1 | NA | 15040 | 0.022 | 0.3036 | No |
| 14 | ATP2B1 | NA | 27034 | -0.018 | 0.0885 | No |
| 15 | FGF23 | NA | 27695 | -0.025 | 0.0826 | No |
| 16 | MIR125B1 | NA | 34621 | -0.092 | -0.0210 | No |
| 17 | CYP24A1 | NA | 38983 | -0.137 | -0.0665 | No |
| 18 | IL15 | NA | 42742 | -0.183 | -0.0895 | No |
| 19 | PTN | NA | 44742 | -0.210 | -0.0731 | No |
| 20 | PENK | NA | 45826 | -0.227 | -0.0358 | No |
| 21 | FES | NA | 51657 | -0.357 | -0.0529 | No |
| 22 | BGLAP | NA | 53209 | -0.424 | 0.0253 | No |