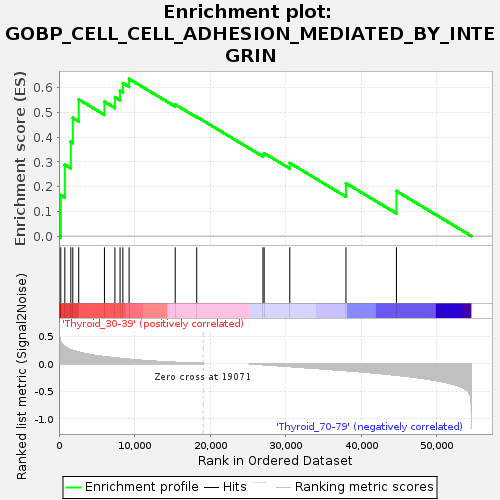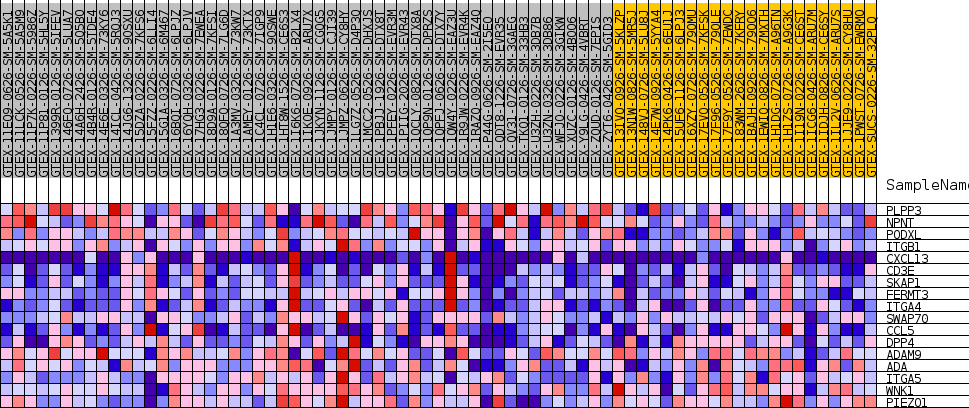
Profile of the Running ES Score & Positions of GeneSet Members on the Rank Ordered List
| Dataset | Thyroid.Thyroid.cls #Thyroid_30-39_versus_Thyroid_70-79.Thyroid.cls #Thyroid_30-39_versus_Thyroid_70-79_repos |
| Phenotype | Thyroid.cls#Thyroid_30-39_versus_Thyroid_70-79_repos |
| Upregulated in class | Thyroid_30-39 |
| GeneSet | GOBP_CELL_CELL_ADHESION_MEDIATED_BY_INTEGRIN |
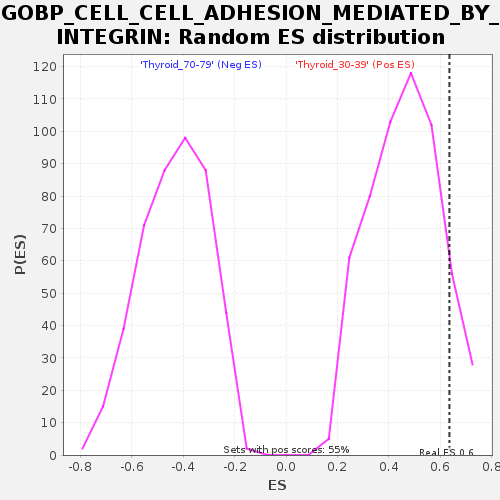
| Enrichment Score (ES) | 0.63533676 |
| Normalized Enrichment Score (NES) | 1.3756899 |
| Nominal p-value | 0.10488246 |
| FDR q-value | 1.0 |
| FWER p-Value | 0.996 |

| SYMBOL | TITLE | RANK IN GENE LIST | RANK METRIC SCORE | RUNNING ES | CORE ENRICHMENT | |
|---|---|---|---|---|---|---|
| 1 | PLPP3 | NA | 233 | 0.392 | 0.1653 | Yes |
| 2 | NPNT | NA | 770 | 0.308 | 0.2887 | Yes |
| 3 | PODXL | NA | 1564 | 0.247 | 0.3811 | Yes |
| 4 | ITGB1 | NA | 1827 | 0.235 | 0.4780 | Yes |
| 5 | CXCL13 | NA | 2612 | 0.205 | 0.5524 | Yes |
| 6 | CD3E | NA | 6016 | 0.123 | 0.5432 | Yes |
| 7 | SKAP1 | NA | 7399 | 0.101 | 0.5614 | Yes |
| 8 | FERMT3 | NA | 8082 | 0.091 | 0.5881 | Yes |
| 9 | ITGA4 | NA | 8453 | 0.085 | 0.6181 | Yes |
| 10 | SWAP70 | NA | 9282 | 0.075 | 0.6353 | Yes |
| 11 | CCL5 | NA | 15384 | 0.020 | 0.5320 | No |
| 12 | DPP4 | NA | 18232 | 0.005 | 0.4822 | No |
| 13 | ADAM9 | NA | 26998 | -0.018 | 0.3294 | No |
| 14 | ADA | NA | 27158 | -0.020 | 0.3350 | No |
| 15 | ITGA5 | NA | 30551 | -0.052 | 0.2954 | No |
| 16 | WNK1 | NA | 37988 | -0.126 | 0.2136 | No |
| 17 | PIEZO1 | NA | 44670 | -0.210 | 0.1818 | No |

