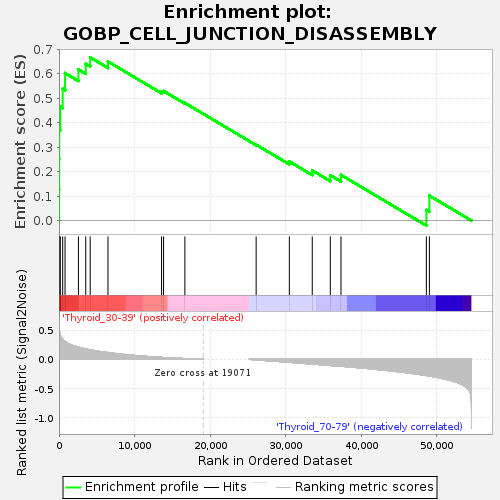
Profile of the Running ES Score & Positions of GeneSet Members on the Rank Ordered List
| Dataset | Thyroid.Thyroid.cls #Thyroid_30-39_versus_Thyroid_70-79.Thyroid.cls #Thyroid_30-39_versus_Thyroid_70-79_repos |
| Phenotype | Thyroid.cls#Thyroid_30-39_versus_Thyroid_70-79_repos |
| Upregulated in class | Thyroid_30-39 |
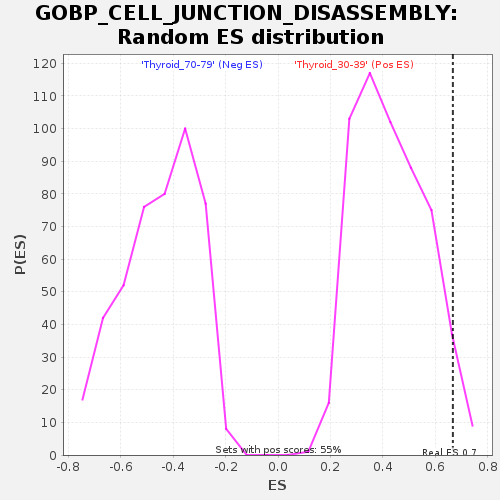
| GeneSet | GOBP_CELL_JUNCTION_DISASSEMBLY |
| Enrichment Score (ES) | 0.6668082 |
| Normalized Enrichment Score (NES) | 1.5501109 |
| Nominal p-value | 0.041970804 |
| FDR q-value | 1.0 |
| FWER p-Value | 0.911 |
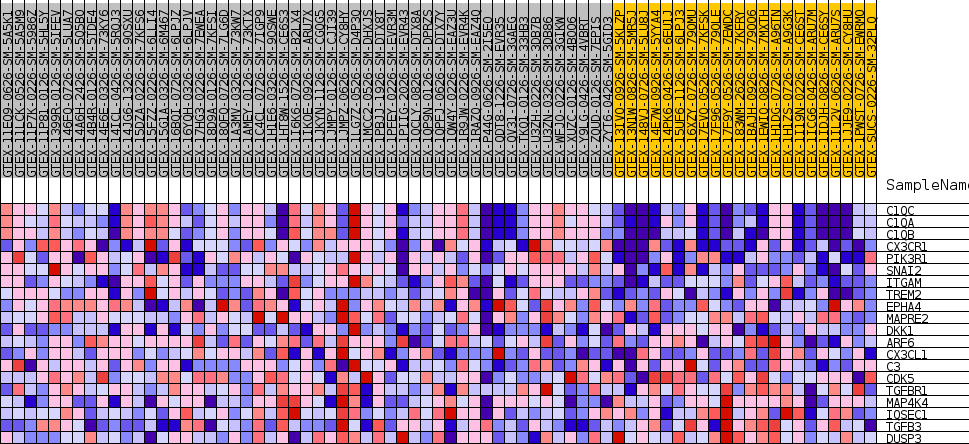
| SYMBOL | TITLE | RANK IN GENE LIST | RANK METRIC SCORE | RUNNING ES | CORE ENRICHMENT | |
|---|---|---|---|---|---|---|
| 1 | C1QC | NA | 22 | 0.551 | 0.1261 | Yes |
| 2 | C1QA | NA | 28 | 0.541 | 0.2502 | Yes |
| 3 | C1QB | NA | 33 | 0.534 | 0.3726 | Yes |
| 4 | CX3CR1 | NA | 174 | 0.417 | 0.4658 | Yes |
| 5 | PIK3R1 | NA | 488 | 0.341 | 0.5385 | Yes |
| 6 | SNAI2 | NA | 801 | 0.305 | 0.6027 | Yes |
| 7 | ITGAM | NA | 2572 | 0.207 | 0.6178 | Yes |
| 8 | TREM2 | NA | 3542 | 0.176 | 0.6405 | Yes |
| 9 | EPHA4 | NA | 4128 | 0.161 | 0.6668 | Yes |
| 10 | MAPRE2 | NA | 6484 | 0.115 | 0.6500 | No |
| 11 | DKK1 | NA | 13576 | 0.032 | 0.5275 | No |
| 12 | ARF6 | NA | 13841 | 0.030 | 0.5296 | No |
| 13 | CX3CL1 | NA | 16665 | 0.012 | 0.4807 | No |
| 14 | C3 | NA | 26097 | -0.010 | 0.3101 | No |
| 15 | CDK5 | NA | 30490 | -0.052 | 0.2415 | No |
| 16 | TGFBR1 | NA | 33526 | -0.082 | 0.2046 | No |
| 17 | MAP4K4 | NA | 35914 | -0.105 | 0.1850 | No |
| 18 | IQSEC1 | NA | 37328 | -0.119 | 0.1865 | No |
| 19 | TGFB3 | NA | 48633 | -0.278 | 0.0432 | No |
| 20 | DUSP3 | NA | 49031 | -0.287 | 0.1019 | No |