Profile of the Running ES Score & Positions of GeneSet Members on the Rank Ordered List
| Dataset | Thyroid.Thyroid.cls #Thyroid_30-39_versus_Thyroid_70-79.Thyroid.cls #Thyroid_30-39_versus_Thyroid_70-79_repos |
| Phenotype | Thyroid.cls#Thyroid_30-39_versus_Thyroid_70-79_repos |
| Upregulated in class | Thyroid_30-39 |
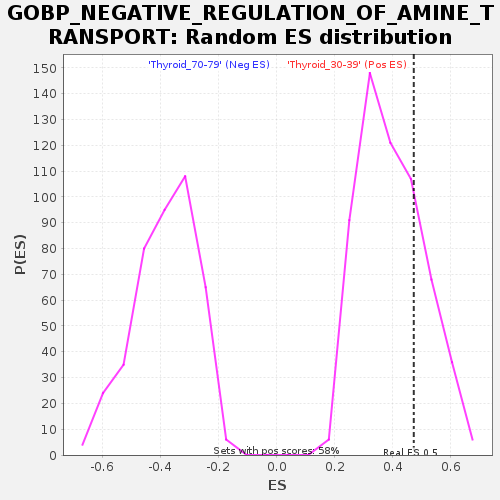
| GeneSet | GOBP_NEGATIVE_REGULATION_OF_AMINE_TRANSPORT |
| Enrichment Score (ES) | 0.47193143 |
| Normalized Enrichment Score (NES) | 1.1944022 |
| Nominal p-value | 0.24013722 |
| FDR q-value | 1.0 |
| FWER p-Value | 1.0 |
| SYMBOL | TITLE | RANK IN GENE LIST | RANK METRIC SCORE | RUNNING ES | CORE ENRICHMENT | |
|---|---|---|---|---|---|---|
| 1 | P2RY12 | NA | 315 | 0.372 | 0.0734 | Yes |
| 2 | CNR1 | NA | 411 | 0.354 | 0.1469 | Yes |
| 3 | NPY5R | NA | 1433 | 0.255 | 0.1823 | Yes |
| 4 | ADRA2C | NA | 1490 | 0.252 | 0.2348 | Yes |
| 5 | SYT11 | NA | 2726 | 0.201 | 0.2550 | Yes |
| 6 | HTR1B | NA | 3027 | 0.191 | 0.2901 | Yes |
| 7 | CHGA | NA | 3323 | 0.183 | 0.3236 | Yes |
| 8 | ADORA1 | NA | 4326 | 0.156 | 0.3384 | Yes |
| 9 | AGTR2 | NA | 4663 | 0.149 | 0.3639 | Yes |
| 10 | LEP | NA | 4936 | 0.143 | 0.3894 | Yes |
| 11 | ARL6IP5 | NA | 5370 | 0.135 | 0.4101 | Yes |
| 12 | ADRA2A | NA | 5817 | 0.126 | 0.4287 | Yes |
| 13 | P2RY1 | NA | 6087 | 0.122 | 0.4497 | Yes |
| 14 | TRH | NA | 6953 | 0.107 | 0.4567 | Yes |
| 15 | SYT4 | NA | 7304 | 0.102 | 0.4719 | Yes |
| 16 | RGS2 | NA | 13139 | 0.036 | 0.3726 | No |
| 17 | ADRA2B | NA | 27188 | -0.020 | 0.1194 | No |
| 18 | RGS4 | NA | 31045 | -0.057 | 0.0609 | No |
| 19 | GHSR | NA | 31254 | -0.059 | 0.0697 | No |
| 20 | GRM7 | NA | 36018 | -0.106 | 0.0050 | No |
| 21 | SLC43A1 | NA | 39348 | -0.141 | -0.0261 | No |
| 22 | HRH3 | NA | 43993 | -0.200 | -0.0687 | No |
| 23 | CRH | NA | 47989 | -0.265 | -0.0855 | No |
| 24 | SNCA | NA | 48045 | -0.266 | -0.0299 | No |
| 25 | DRD2 | NA | 51379 | -0.348 | -0.0170 | No |
| 26 | SLC43A2 | NA | 51665 | -0.357 | 0.0536 | No |