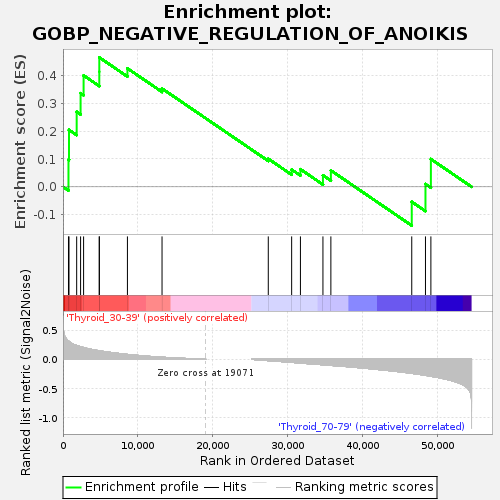
Profile of the Running ES Score & Positions of GeneSet Members on the Rank Ordered List
| Dataset | Thyroid.Thyroid.cls #Thyroid_30-39_versus_Thyroid_70-79.Thyroid.cls #Thyroid_30-39_versus_Thyroid_70-79_repos |
| Phenotype | Thyroid.cls#Thyroid_30-39_versus_Thyroid_70-79_repos |
| Upregulated in class | Thyroid_30-39 |
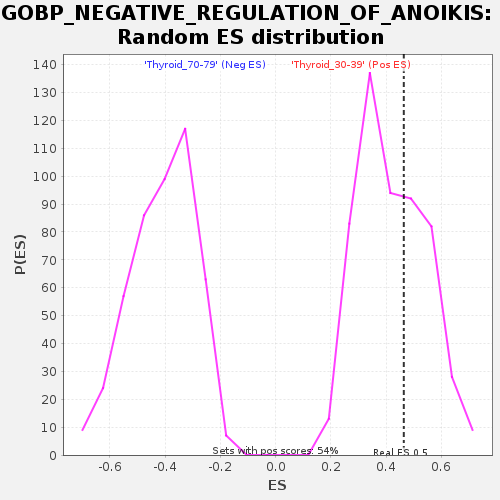
| GeneSet | GOBP_NEGATIVE_REGULATION_OF_ANOIKIS |
| Enrichment Score (ES) | 0.4643508 |
| Normalized Enrichment Score (NES) | 1.1048887 |
| Nominal p-value | 0.3605948 |
| FDR q-value | 1.0 |
| FWER p-Value | 1.0 |
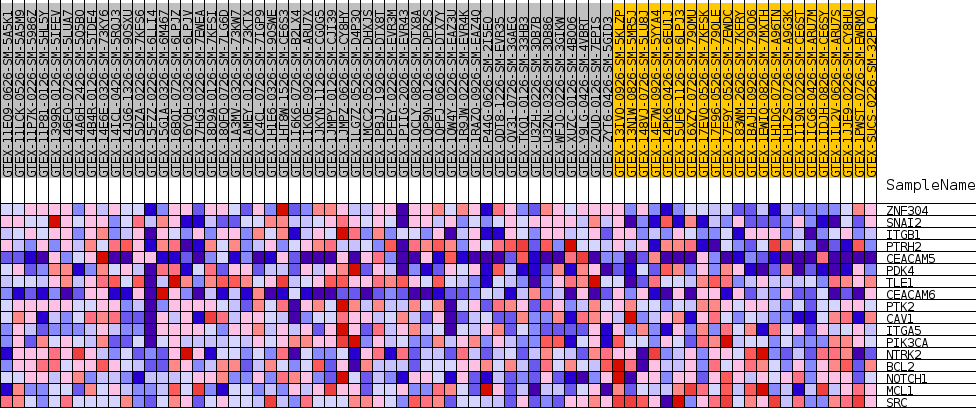
| SYMBOL | TITLE | RANK IN GENE LIST | RANK METRIC SCORE | RUNNING ES | CORE ENRICHMENT | |
|---|---|---|---|---|---|---|
| 1 | ZNF304 | NA | 732 | 0.312 | 0.0975 | Yes |
| 2 | SNAI2 | NA | 801 | 0.305 | 0.2045 | Yes |
| 3 | ITGB1 | NA | 1827 | 0.235 | 0.2693 | Yes |
| 4 | PTRH2 | NA | 2350 | 0.214 | 0.3358 | Yes |
| 5 | CEACAM5 | NA | 2752 | 0.201 | 0.3997 | Yes |
| 6 | PDK4 | NA | 4849 | 0.145 | 0.4129 | Yes |
| 7 | TLE1 | NA | 4851 | 0.145 | 0.4644 | Yes |
| 8 | CEACAM6 | NA | 8608 | 0.083 | 0.4251 | No |
| 9 | PTK2 | NA | 13232 | 0.035 | 0.3528 | No |
| 10 | CAV1 | NA | 27428 | -0.022 | 0.1006 | No |
| 11 | ITGA5 | NA | 30551 | -0.052 | 0.0619 | No |
| 12 | PIK3CA | NA | 31724 | -0.064 | 0.0631 | No |
| 13 | NTRK2 | NA | 34731 | -0.094 | 0.0413 | No |
| 14 | BCL2 | NA | 35791 | -0.104 | 0.0589 | No |
| 15 | NOTCH1 | NA | 46598 | -0.240 | -0.0538 | No |
| 16 | MCL1 | NA | 48431 | -0.274 | 0.0099 | No |
| 17 | SRC | NA | 49154 | -0.290 | 0.0996 | No |