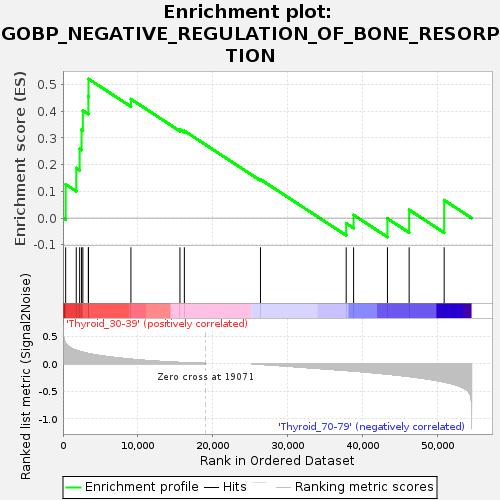
Profile of the Running ES Score & Positions of GeneSet Members on the Rank Ordered List
| Dataset | Thyroid.Thyroid.cls #Thyroid_30-39_versus_Thyroid_70-79.Thyroid.cls #Thyroid_30-39_versus_Thyroid_70-79_repos |
| Phenotype | Thyroid.cls#Thyroid_30-39_versus_Thyroid_70-79_repos |
| Upregulated in class | Thyroid_30-39 |
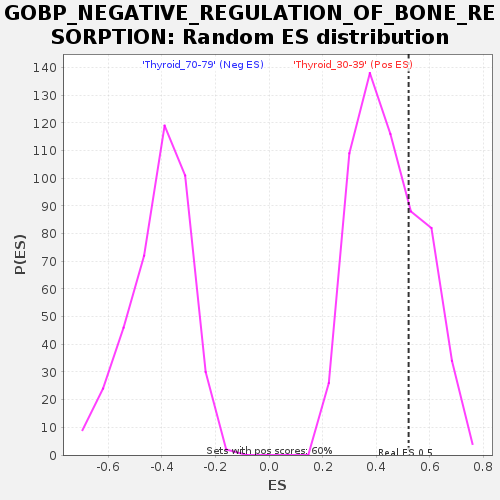
| GeneSet | GOBP_NEGATIVE_REGULATION_OF_BONE_RESORPTION |
| Enrichment Score (ES) | 0.5210531 |
| Normalized Enrichment Score (NES) | 1.1713693 |
| Nominal p-value | 0.279732 |
| FDR q-value | 1.0 |
| FWER p-Value | 1.0 |
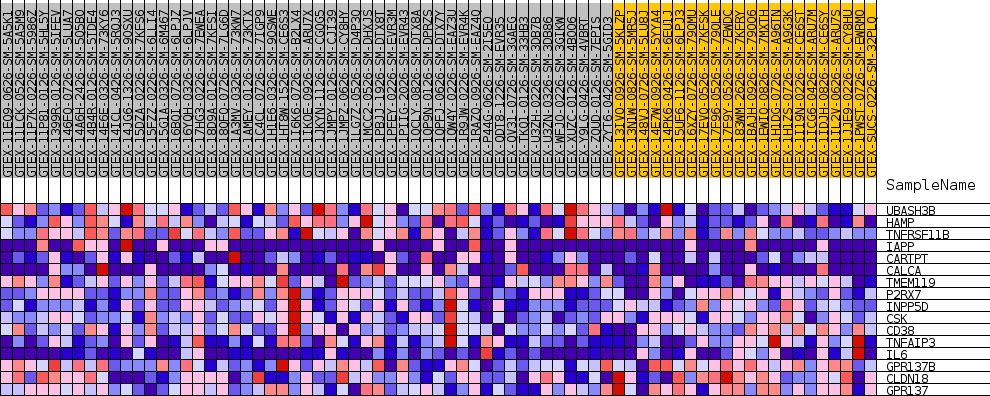
| SYMBOL | TITLE | RANK IN GENE LIST | RANK METRIC SCORE | RUNNING ES | CORE ENRICHMENT | |
|---|---|---|---|---|---|---|
| 1 | UBASH3B | NA | 357 | 0.363 | 0.1262 | Yes |
| 2 | HAMP | NA | 1771 | 0.237 | 0.1871 | Yes |
| 3 | TNFRSF11B | NA | 2224 | 0.220 | 0.2592 | Yes |
| 4 | IAPP | NA | 2479 | 0.210 | 0.3313 | Yes |
| 5 | CARTPT | NA | 2654 | 0.204 | 0.4027 | Yes |
| 6 | CALCA | NA | 3385 | 0.181 | 0.4555 | Yes |
| 7 | TMEM119 | NA | 3405 | 0.180 | 0.5211 | Yes |
| 8 | P2RX7 | NA | 9074 | 0.077 | 0.4454 | No |
| 9 | INPP5D | NA | 15626 | 0.018 | 0.3319 | No |
| 10 | CSK | NA | 16216 | 0.015 | 0.3265 | No |
| 11 | CD38 | NA | 26386 | -0.013 | 0.1448 | No |
| 12 | TNFAIP3 | NA | 37838 | -0.124 | -0.0197 | No |
| 13 | IL6 | NA | 38829 | -0.135 | 0.0116 | No |
| 14 | GPR137B | NA | 43352 | -0.190 | -0.0017 | No |
| 15 | CLDN18 | NA | 46249 | -0.234 | 0.0308 | No |
| 16 | GPR137 | NA | 50930 | -0.334 | 0.0671 | No |