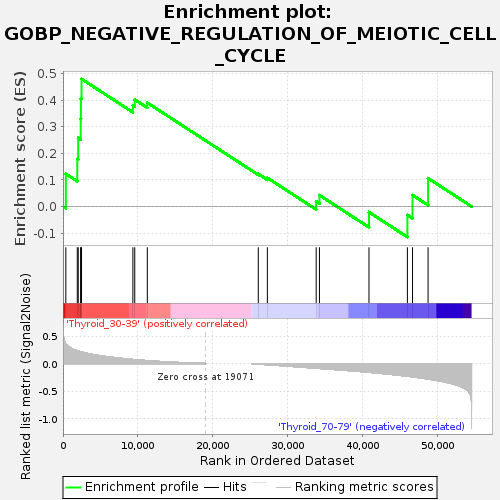
Profile of the Running ES Score & Positions of GeneSet Members on the Rank Ordered List
| Dataset | Thyroid.Thyroid.cls #Thyroid_30-39_versus_Thyroid_70-79.Thyroid.cls #Thyroid_30-39_versus_Thyroid_70-79_repos |
| Phenotype | Thyroid.cls#Thyroid_30-39_versus_Thyroid_70-79_repos |
| Upregulated in class | Thyroid_30-39 |
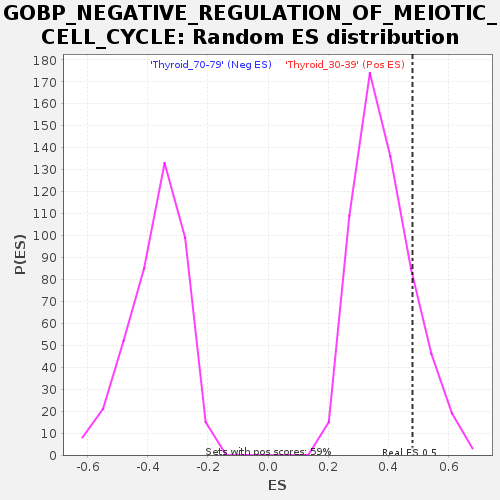
| GeneSet | GOBP_NEGATIVE_REGULATION_OF_MEIOTIC_CELL_CYCLE |
| Enrichment Score (ES) | 0.4802589 |
| Normalized Enrichment Score (NES) | 1.2477512 |
| Nominal p-value | 0.16354345 |
| FDR q-value | 1.0 |
| FWER p-Value | 1.0 |
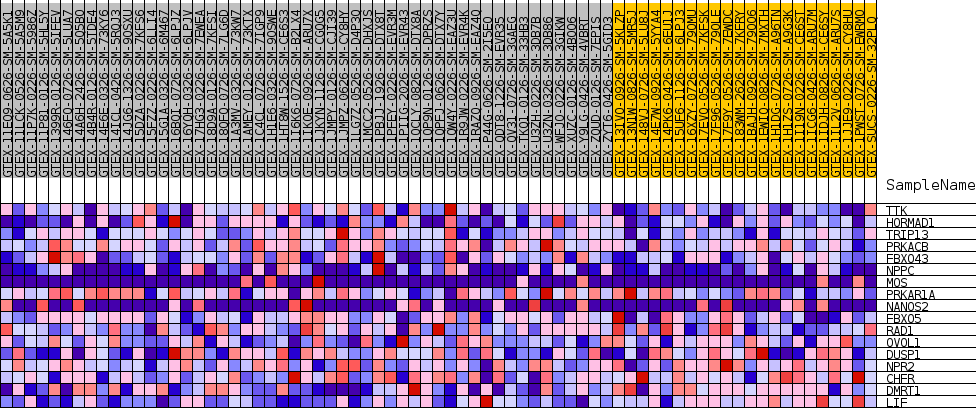
| SYMBOL | TITLE | RANK IN GENE LIST | RANK METRIC SCORE | RUNNING ES | CORE ENRICHMENT | |
|---|---|---|---|---|---|---|
| 1 | TTK | NA | 378 | 0.360 | 0.1229 | Yes |
| 2 | HORMAD1 | NA | 1907 | 0.232 | 0.1785 | Yes |
| 3 | TRIP13 | NA | 2034 | 0.227 | 0.2582 | Yes |
| 4 | PRKACB | NA | 2365 | 0.214 | 0.3295 | Yes |
| 5 | FBXO43 | NA | 2394 | 0.213 | 0.4059 | Yes |
| 6 | NPPC | NA | 2476 | 0.210 | 0.4803 | Yes |
| 7 | MOS | NA | 9338 | 0.074 | 0.3813 | No |
| 8 | PRKAR1A | NA | 9586 | 0.071 | 0.4024 | No |
| 9 | NANOS2 | NA | 11265 | 0.052 | 0.3906 | No |
| 10 | FBXO5 | NA | 26091 | -0.010 | 0.1225 | No |
| 11 | RAD1 | NA | 27307 | -0.021 | 0.1078 | No |
| 12 | OVOL1 | NA | 33830 | -0.084 | 0.0188 | No |
| 13 | DUSP1 | NA | 34265 | -0.088 | 0.0427 | No |
| 14 | NPR2 | NA | 40883 | -0.159 | -0.0211 | No |
| 15 | CHFR | NA | 46016 | -0.231 | -0.0319 | No |
| 16 | DMRT1 | NA | 46700 | -0.242 | 0.0429 | No |
| 17 | LIF | NA | 48778 | -0.282 | 0.1065 | No |