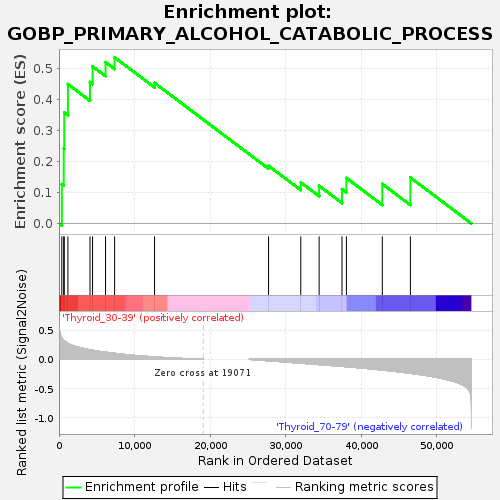
Profile of the Running ES Score & Positions of GeneSet Members on the Rank Ordered List
| Dataset | Thyroid.Thyroid.cls #Thyroid_30-39_versus_Thyroid_70-79.Thyroid.cls #Thyroid_30-39_versus_Thyroid_70-79_repos |
| Phenotype | Thyroid.cls#Thyroid_30-39_versus_Thyroid_70-79_repos |
| Upregulated in class | Thyroid_30-39 |
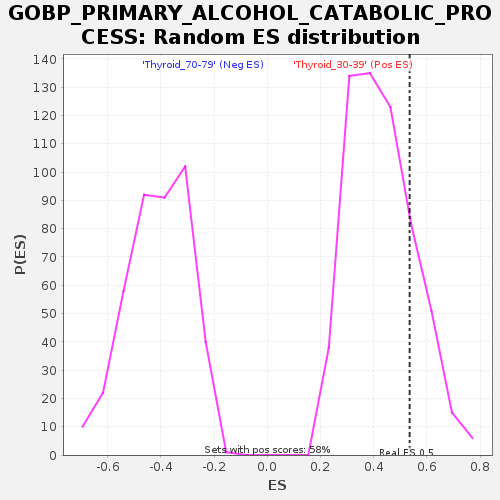
| GeneSet | GOBP_PRIMARY_ALCOHOL_CATABOLIC_PROCESS |
| Enrichment Score (ES) | 0.5352353 |
| Normalized Enrichment Score (NES) | 1.2541386 |
| Nominal p-value | 0.18835616 |
| FDR q-value | 1.0 |
| FWER p-Value | 1.0 |
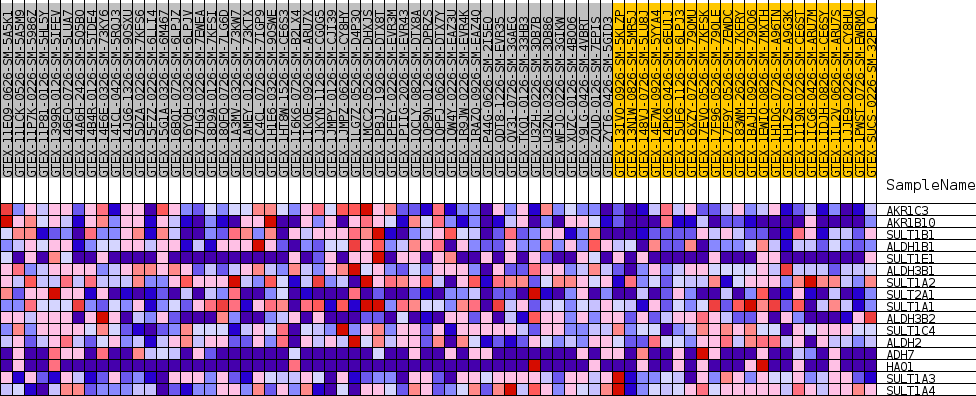
| SYMBOL | TITLE | RANK IN GENE LIST | RANK METRIC SCORE | RUNNING ES | CORE ENRICHMENT | |
|---|---|---|---|---|---|---|
| 1 | AKR1C3 | NA | 374 | 0.361 | 0.1269 | Yes |
| 2 | AKR1B10 | NA | 624 | 0.323 | 0.2419 | Yes |
| 3 | SULT1B1 | NA | 696 | 0.316 | 0.3576 | Yes |
| 4 | ALDH1B1 | NA | 1180 | 0.271 | 0.4492 | Yes |
| 5 | SULT1E1 | NA | 4104 | 0.162 | 0.4557 | Yes |
| 6 | ALDH3B1 | NA | 4443 | 0.154 | 0.5064 | Yes |
| 7 | SULT1A2 | NA | 6160 | 0.121 | 0.5197 | Yes |
| 8 | SULT2A1 | NA | 7363 | 0.101 | 0.5352 | Yes |
| 9 | SULT1A1 | NA | 12650 | 0.039 | 0.4530 | No |
| 10 | ALDH3B2 | NA | 27742 | -0.025 | 0.1858 | No |
| 11 | SULT1C4 | NA | 32006 | -0.067 | 0.1324 | No |
| 12 | ALDH2 | NA | 34435 | -0.090 | 0.1213 | No |
| 13 | ADH7 | NA | 37460 | -0.120 | 0.1105 | No |
| 14 | HAO1 | NA | 38047 | -0.127 | 0.1468 | No |
| 15 | SULT1A3 | NA | 42798 | -0.183 | 0.1276 | No |
| 16 | SULT1A4 | NA | 46516 | -0.239 | 0.1480 | No |