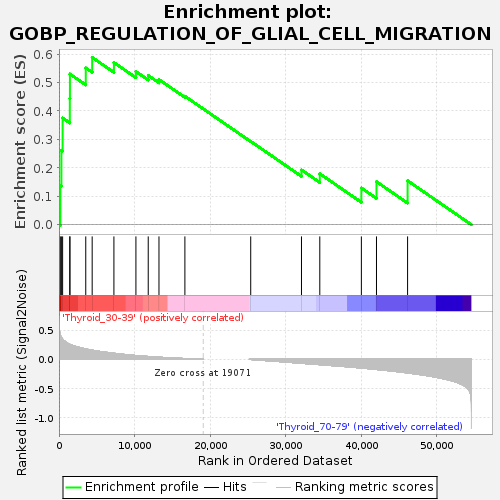
Profile of the Running ES Score & Positions of GeneSet Members on the Rank Ordered List
| Dataset | Thyroid.Thyroid.cls #Thyroid_30-39_versus_Thyroid_70-79.Thyroid.cls #Thyroid_30-39_versus_Thyroid_70-79_repos |
| Phenotype | Thyroid.cls#Thyroid_30-39_versus_Thyroid_70-79_repos |
| Upregulated in class | Thyroid_30-39 |
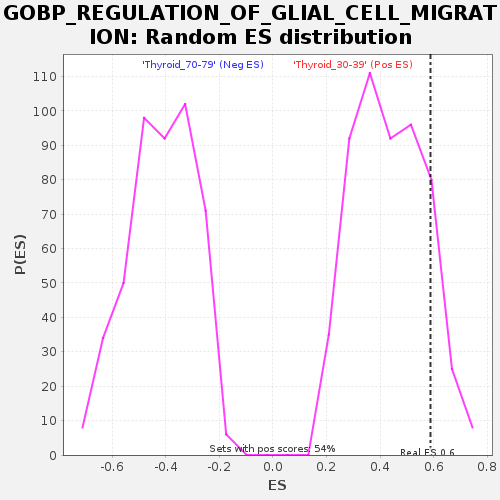
| GeneSet | GOBP_REGULATION_OF_GLIAL_CELL_MIGRATION |
| Enrichment Score (ES) | 0.5884679 |
| Normalized Enrichment Score (NES) | 1.3520616 |
| Nominal p-value | 0.148423 |
| FDR q-value | 1.0 |
| FWER p-Value | 0.997 |
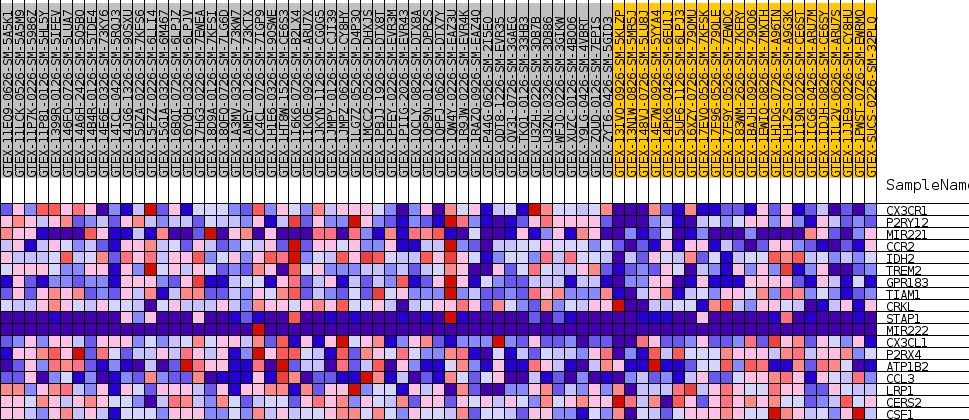
| SYMBOL | TITLE | RANK IN GENE LIST | RANK METRIC SCORE | RUNNING ES | CORE ENRICHMENT | |
|---|---|---|---|---|---|---|
| 1 | CX3CR1 | NA | 174 | 0.417 | 0.1383 | Yes |
| 2 | P2RY12 | NA | 315 | 0.372 | 0.2619 | Yes |
| 3 | MIR221 | NA | 479 | 0.344 | 0.3753 | Yes |
| 4 | CCR2 | NA | 1430 | 0.255 | 0.4443 | Yes |
| 5 | IDH2 | NA | 1446 | 0.254 | 0.5301 | Yes |
| 6 | TREM2 | NA | 3542 | 0.176 | 0.5515 | Yes |
| 7 | GPR183 | NA | 4391 | 0.155 | 0.5885 | Yes |
| 8 | TIAM1 | NA | 7269 | 0.102 | 0.5705 | No |
| 9 | CRKL | NA | 10182 | 0.064 | 0.5388 | No |
| 10 | STAP1 | NA | 11812 | 0.047 | 0.5249 | No |
| 11 | MIR222 | NA | 13234 | 0.035 | 0.5107 | No |
| 12 | CX3CL1 | NA | 16665 | 0.012 | 0.4520 | No |
| 13 | P2RX4 | NA | 25380 | -0.002 | 0.2930 | No |
| 14 | ATP1B2 | NA | 32099 | -0.068 | 0.1929 | No |
| 15 | CCL3 | NA | 34524 | -0.091 | 0.1794 | No |
| 16 | LRP1 | NA | 40027 | -0.149 | 0.1291 | No |
| 17 | CERS2 | NA | 42028 | -0.174 | 0.1513 | No |
| 18 | CSF1 | NA | 46146 | -0.233 | 0.1547 | No |