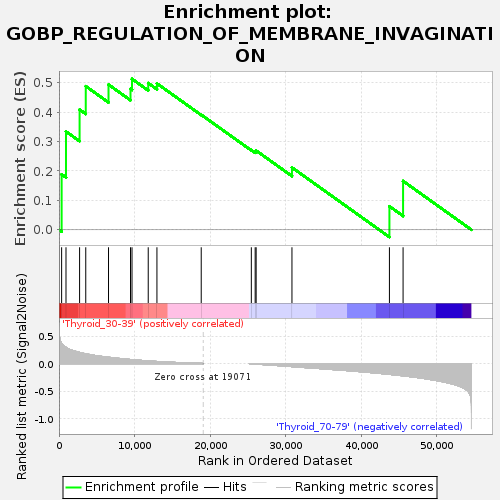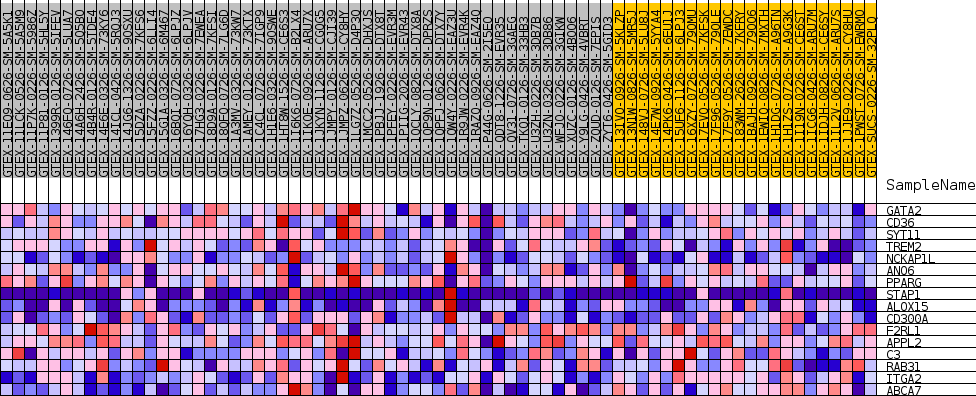
Profile of the Running ES Score & Positions of GeneSet Members on the Rank Ordered List
| Dataset | Thyroid.Thyroid.cls #Thyroid_30-39_versus_Thyroid_70-79.Thyroid.cls #Thyroid_30-39_versus_Thyroid_70-79_repos |
| Phenotype | Thyroid.cls#Thyroid_30-39_versus_Thyroid_70-79_repos |
| Upregulated in class | Thyroid_30-39 |
| GeneSet | GOBP_REGULATION_OF_MEMBRANE_INVAGINATION |
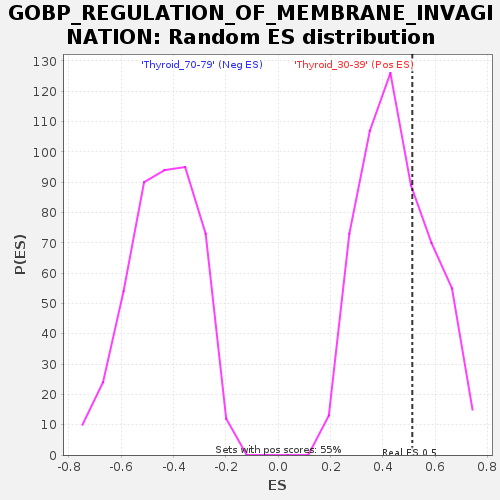
| Enrichment Score (ES) | 0.5126448 |
| Normalized Enrichment Score (NES) | 1.1351279 |
| Nominal p-value | 0.3211679 |
| FDR q-value | 1.0 |
| FWER p-Value | 1.0 |

| SYMBOL | TITLE | RANK IN GENE LIST | RANK METRIC SCORE | RUNNING ES | CORE ENRICHMENT | |
|---|---|---|---|---|---|---|
| 1 | GATA2 | NA | 348 | 0.365 | 0.1884 | Yes |
| 2 | CD36 | NA | 926 | 0.292 | 0.3340 | Yes |
| 3 | SYT11 | NA | 2726 | 0.201 | 0.4085 | Yes |
| 4 | TREM2 | NA | 3542 | 0.176 | 0.4878 | Yes |
| 5 | NCKAP1L | NA | 6555 | 0.114 | 0.4933 | Yes |
| 6 | ANO6 | NA | 9465 | 0.073 | 0.4788 | Yes |
| 7 | PPARG | NA | 9664 | 0.070 | 0.5126 | Yes |
| 8 | STAP1 | NA | 11812 | 0.047 | 0.4984 | No |
| 9 | ALOX15 | NA | 12964 | 0.037 | 0.4971 | No |
| 10 | CD300A | NA | 18827 | 0.002 | 0.3910 | No |
| 11 | F2RL1 | NA | 25460 | -0.003 | 0.2710 | No |
| 12 | APPL2 | NA | 25968 | -0.009 | 0.2663 | No |
| 13 | C3 | NA | 26097 | -0.010 | 0.2691 | No |
| 14 | RAB31 | NA | 30838 | -0.055 | 0.2116 | No |
| 15 | ITGA2 | NA | 43741 | -0.196 | 0.0799 | No |
| 16 | ABCA7 | NA | 45549 | -0.223 | 0.1657 | No |

