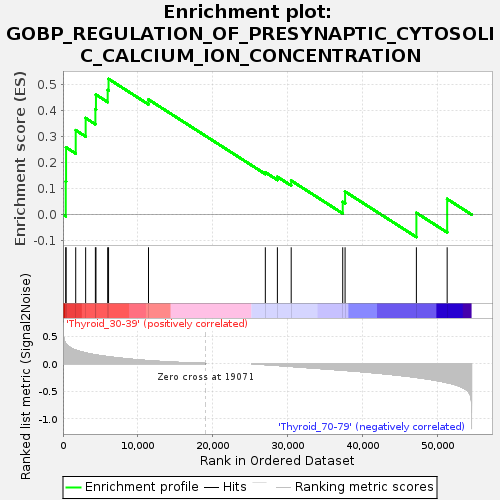
Profile of the Running ES Score & Positions of GeneSet Members on the Rank Ordered List
| Dataset | Thyroid.Thyroid.cls #Thyroid_30-39_versus_Thyroid_70-79.Thyroid.cls #Thyroid_30-39_versus_Thyroid_70-79_repos |
| Phenotype | Thyroid.cls#Thyroid_30-39_versus_Thyroid_70-79_repos |
| Upregulated in class | Thyroid_30-39 |
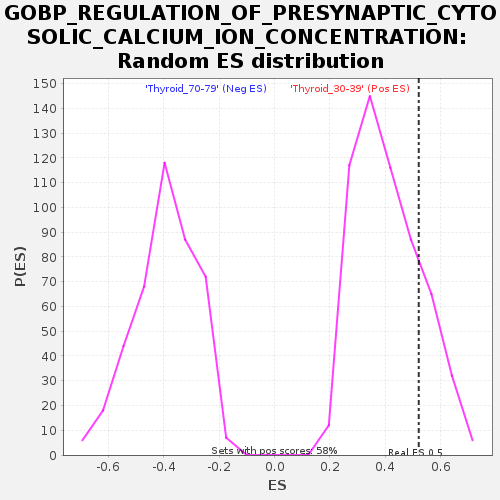
| GeneSet | GOBP_REGULATION_OF_PRESYNAPTIC_CYTOSOLIC_CALCIUM_ION_CONCENTRATION |
| Enrichment Score (ES) | 0.52019846 |
| Normalized Enrichment Score (NES) | 1.2725385 |
| Nominal p-value | 0.19310345 |
| FDR q-value | 1.0 |
| FWER p-Value | 1.0 |
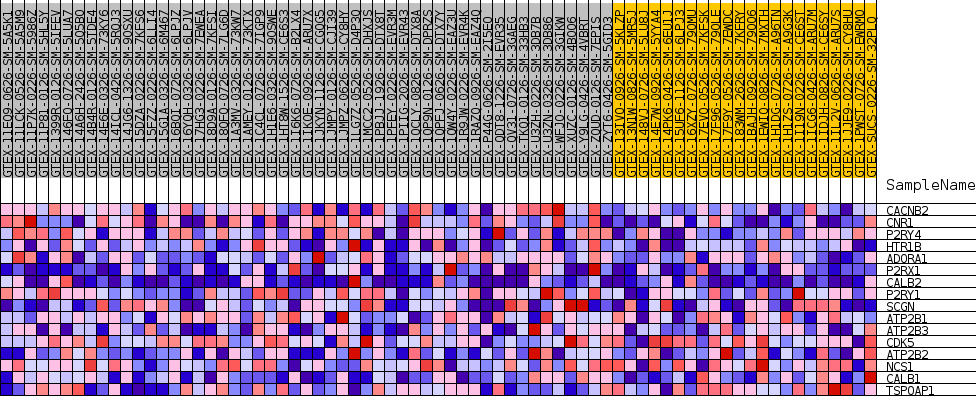
| SYMBOL | TITLE | RANK IN GENE LIST | RANK METRIC SCORE | RUNNING ES | CORE ENRICHMENT | |
|---|---|---|---|---|---|---|
| 1 | CACNB2 | NA | 367 | 0.362 | 0.1273 | Yes |
| 2 | CNR1 | NA | 411 | 0.354 | 0.2576 | Yes |
| 3 | P2RY4 | NA | 1699 | 0.241 | 0.3235 | Yes |
| 4 | HTR1B | NA | 3027 | 0.191 | 0.3700 | Yes |
| 5 | ADORA1 | NA | 4326 | 0.156 | 0.4041 | Yes |
| 6 | P2RX1 | NA | 4404 | 0.155 | 0.4600 | Yes |
| 7 | CALB2 | NA | 5971 | 0.124 | 0.4772 | Yes |
| 8 | P2RY1 | NA | 6087 | 0.122 | 0.5202 | Yes |
| 9 | SCGN | NA | 11423 | 0.051 | 0.4413 | No |
| 10 | ATP2B1 | NA | 27034 | -0.018 | 0.1621 | No |
| 11 | ATP2B3 | NA | 28645 | -0.033 | 0.1449 | No |
| 12 | CDK5 | NA | 30490 | -0.052 | 0.1303 | No |
| 13 | ATP2B2 | NA | 37376 | -0.120 | 0.0485 | No |
| 14 | NCS1 | NA | 37690 | -0.123 | 0.0882 | No |
| 15 | CALB1 | NA | 47218 | -0.251 | 0.0067 | No |
| 16 | TSPOAP1 | NA | 51329 | -0.346 | 0.0598 | No |