
ADEIP is a platform for exploring age-dependent expression and immune profiles across human tissues. All the results, including gene expression, cell ratio, age, differential analysis, gene immune-related function, subcellular location, and two datasets (SARS-CoV-2-associated genes and hMSC-assoicated genes) are organized in ADEIP. The main function of ADEIP is composed of three pages: Browse, Search and Example. Google Chrome browser is recommended to view the ADEIP.
1. Browse page
In this page, users can browse the results (e.g., the average TPM, the average cell ratio, differential analysis, gene annotation, correlation analysis of gene expression and cell composition) of six age groups in thirty tissues. While users select one immunological category, all gene symbol which are annotated matching will be displayed on gene symbol checkbox.
(1) Expression
The average TPM of six age groups and different gender in thirty tissues are shown(Figure 1-1).

Figure 1-1. Expression
(2) Expression-Differential analysis
The differences of gene expression among pairings of six age groups in thirty tissues by DESeq2 are shown(Figure 1-2).

Figure 1-2. Expression-Differential analysis
(3) Annotation
Annotation information including ensembl id, chromosome, chromosome start, chromosome end,chain,gene type, subcellular location, immunological annotated source and immunological annotation are shown(Figure 1-3).

Figure 1-3. Annotation
(4) Cell type
The average cell ratio using the cibersort algorithm of six age groups and different gender in thirty tissues are shown(Figure 1-4).
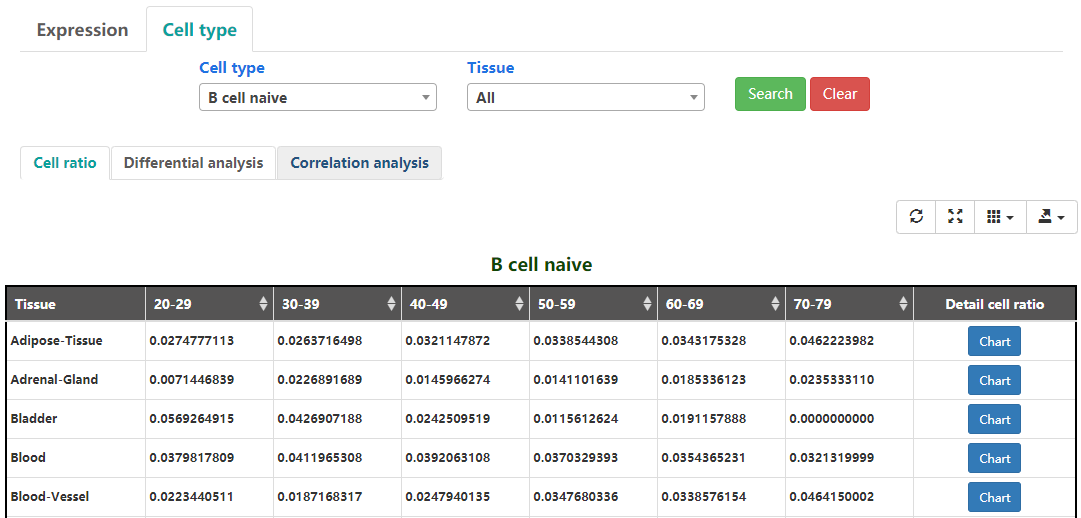
Figure 1-4. Cell type
(5) Cell type-Differential analysis
The differences of cell ratio among pairings of six age groups in thirty tissues by Mann-Whitney U test are shown(Figure 1-5).

Figure 1-5. Cell type-Differential analysis
(6) Correlation analysis
The differentially expressed genes were analyzed using R package DESeq2 are shown(Figure 1-6).

Figure 1-6. Correlation analysis
(7) Chart
Gene experssion in the specific tissue being shown in this chart made up by the box plot and broken line graph(Figure 1-7). Users can specify one or more of all samples, male, female, average tpm, average tpm of male and average tpm of female to display the results of the objects which they interest in(Figure 1-8). So does cell ratio.
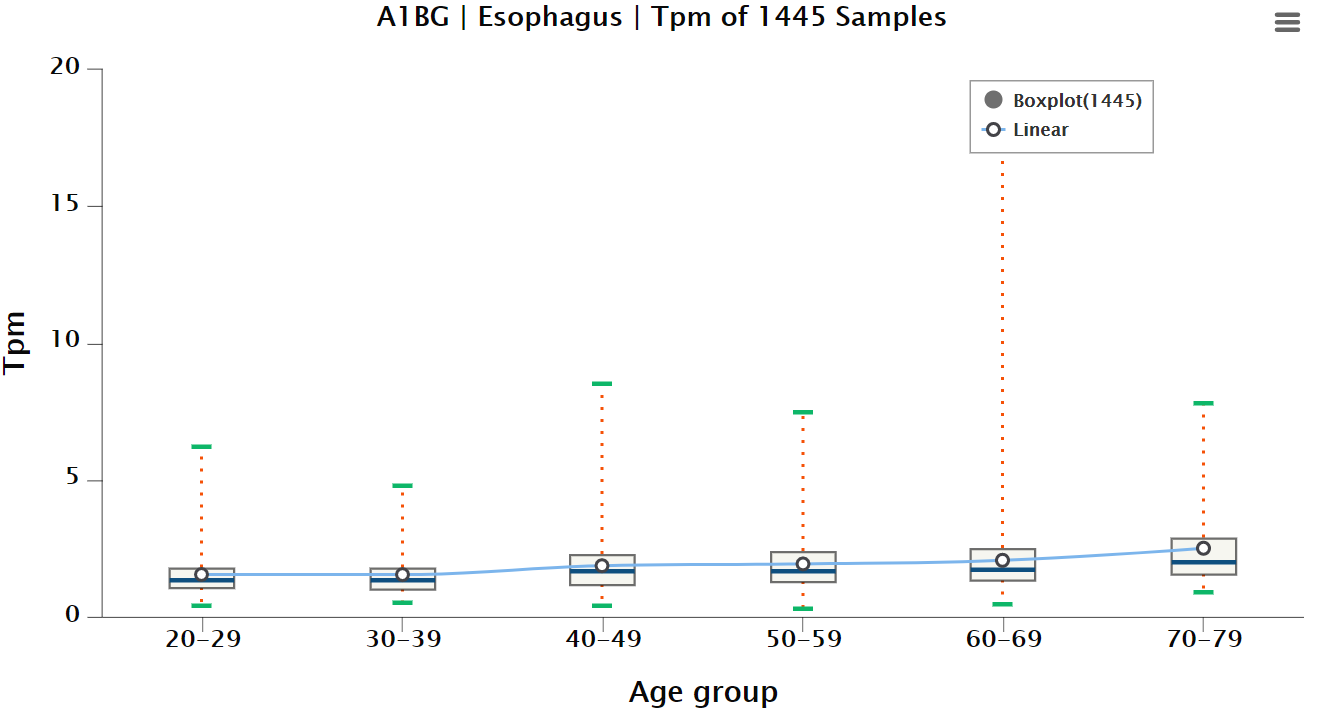
Figure 1-7. Chart
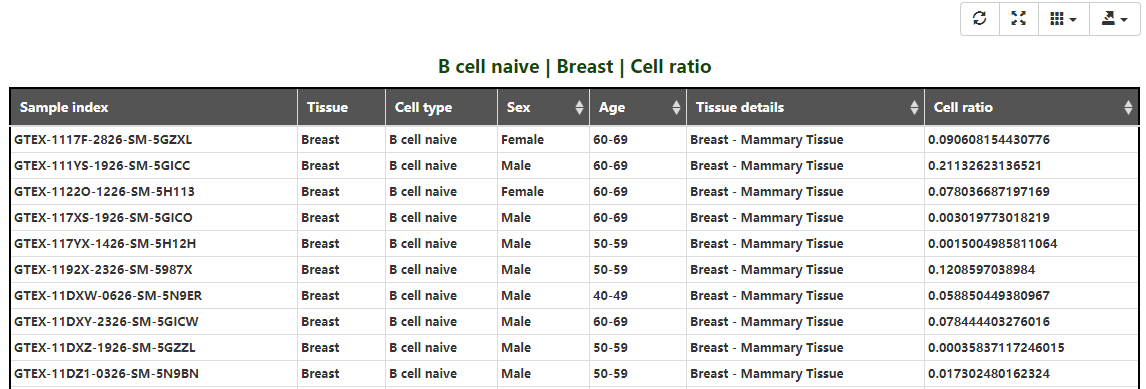
Figure 1-8. Sample details
2. Search page
In this page, users can select statistically significant results by log2(FoldChange), Group, p-adjust and p-value, GSEA. The DESeq2 results of each genesymbol are shown(Figure 2-1). The Mann-Whitney U test results of each cell type are also shown(Figure 2-2).
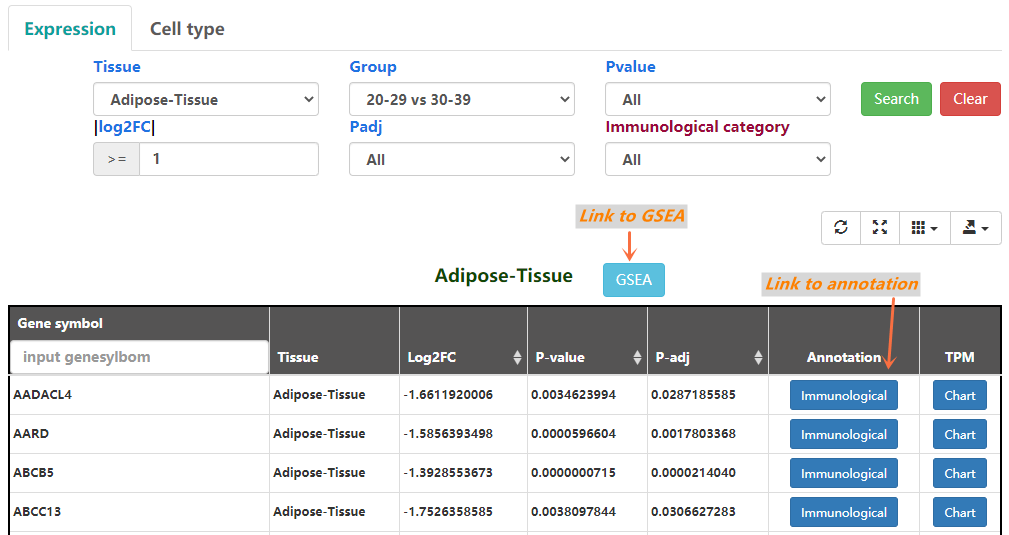
Figure 2-1. Expression-Differential analysis

Figure 2-2. Cell ratio-Differential analysis
3. Example page
In this page, two gene sets and their interactional medicative compound (SARS-CoV-2 and hMSC) were collected to demonstrate the usage of our database. Moreover, users can click Gene symbol link to Browse page.
(1) Genes
Clicking chart links to chart page. If the gene expression was statistically significant(p-adj < 0.05 and |Log2FC|> 1) in the age contrastive group in the tissue , the total number of samples for this age contrastive group in this tissue will be plotted(Figure 3-1 and 3-2).

Figure 3-1. SARS-CoV-2-associated genes.
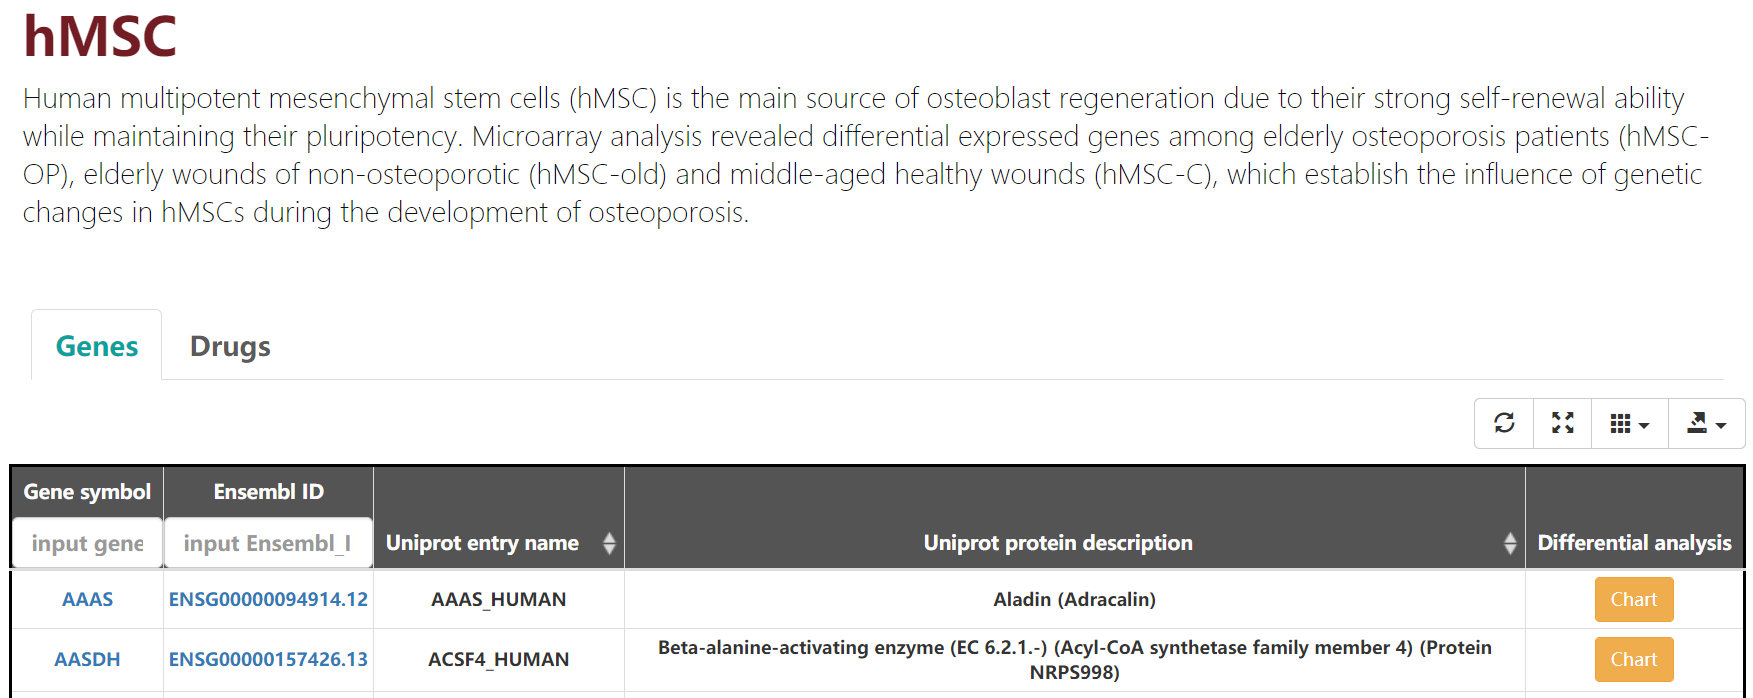
Figure 3-2. hMSC-associated genes.
(2) Drugs
In this pages, medicative compound which can interact with SARS-CoV-2-associated genes/hMSC-associated genes are annotated(Figure 3-3/3-4). Users can click reference to explore the details of them.
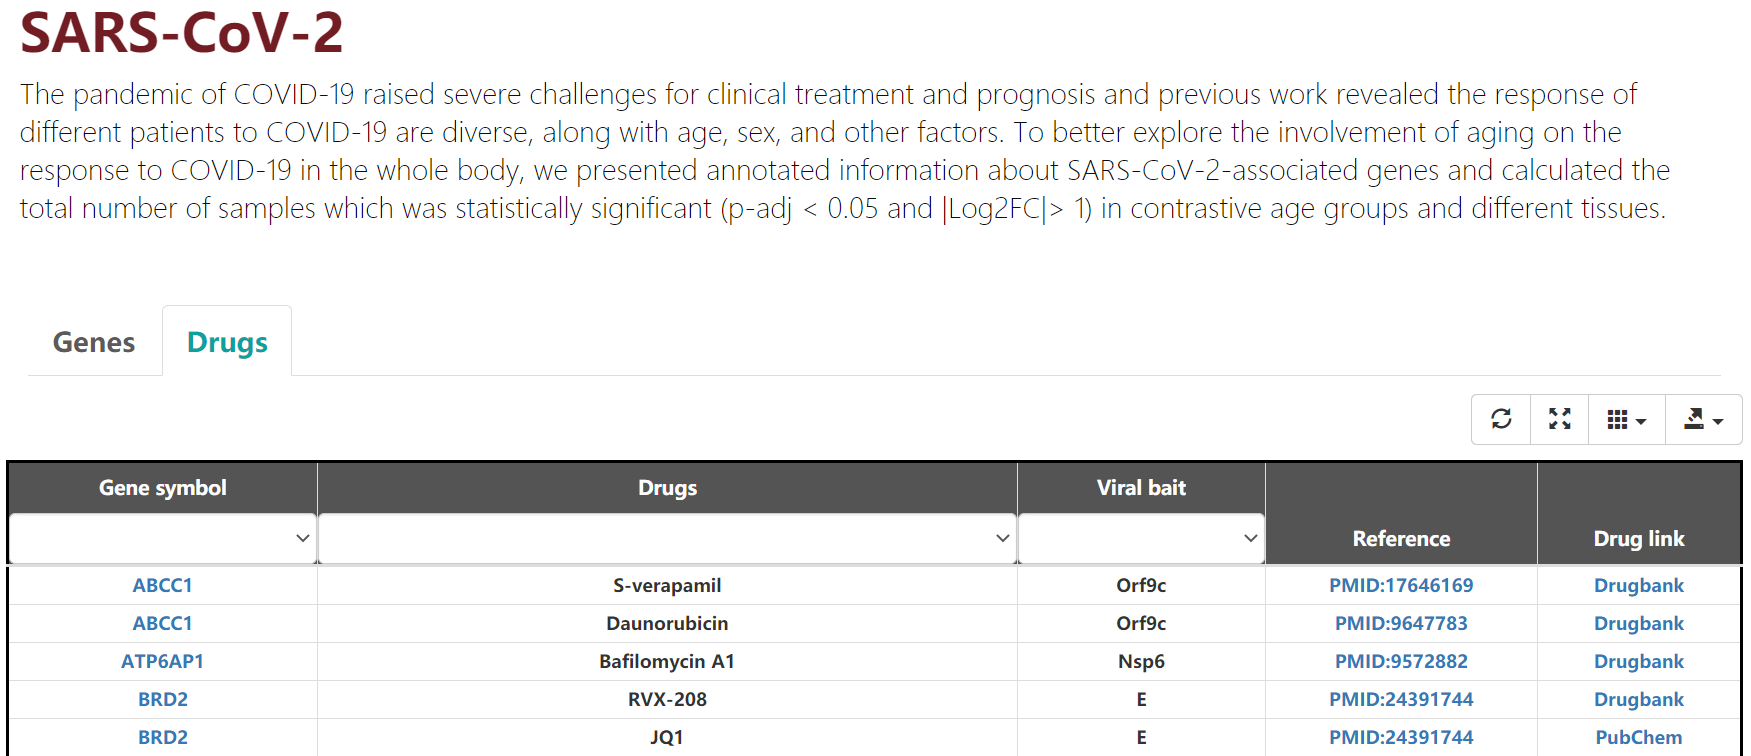
Figure 3-3. SARS-CoV-2 Drugs.

Figure 3-4. hMSC Drugs.
4. Download page
All the original data files of the database are provided in this page.